
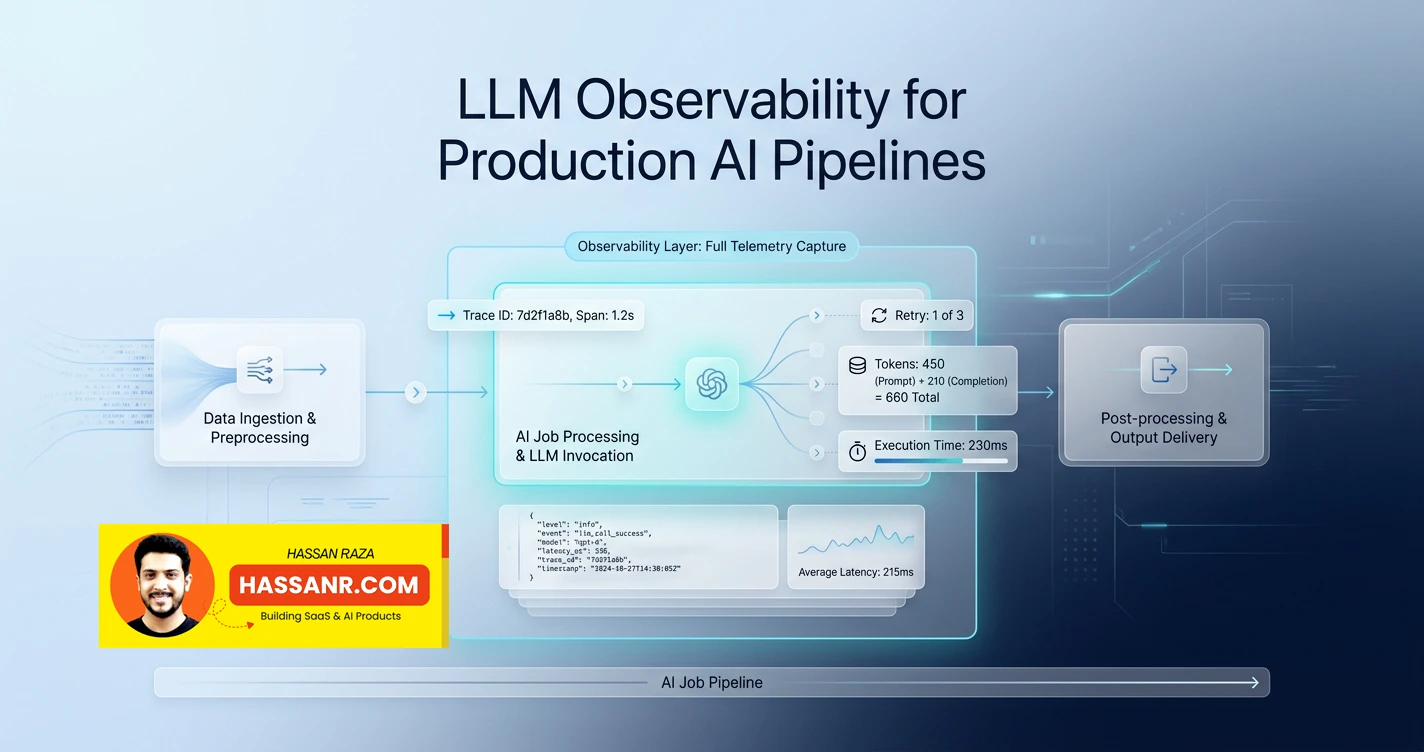
I run a production AI pipeline that makes 161 sequential GPT-4o calls per job at $15–25 each. If batch 88 of 161 fails silently and I don't know which batch it was, the job restarts from zero — costing another $15–25 in wasted API calls. So before I ever looked at a $300/month observability tool, I built four logging primitives that tell me exactly which batch failed, how many retries it took, what the token count was, and how long it ran. Here's what those primitives are — and what a real tracing layer adds on top of them.
Why AI Pipelines Go Blind in Production (And Why Standard APM Doesn't Help)
Standard application monitoring tells you a request succeeded or failed — it cannot tell you which of 161 LLM calls degraded, why a model retried three times, or whether output quality is drifting from baseline.
Standard APM tracks latency, error rate, and throughput — the four golden signals. These work for deterministic systems where "the request succeeded" is sufficient signal. They fail for LLM pipelines where a request can return HTTP 200 with no exception and still produce degraded output: compressed answers for batches at the end of a long context window, hallucinated content the model invented from training data rather than injected facts, or a response that passes JSON parsing but fails output schema validation. None of these are visible in standard APM.
The market reflects the gap: 73% of enterprises require AI agent monitoring in production, yet 63.4% cite a lack of adequate observability tooling as a major barrier. Only 15% of GenAI deployments instrument any observability today (Gartner, early 2026) — with Gartner forecasting that reaches 50% by 2028. The LLM observability platform market is valued at $2.69 billion in 2026 and projected to reach $9.26 billion by 2030. Two things are true simultaneously: the tools exist and most teams aren't using them. The reason is that the gap between "add a $300/month tool" and "log nothing" hasn't been clearly explained.
What goes wrong when you don't instrument
Three concrete failure modes are invisible without structured logging:
- Silent batch failure. The job completes, but batch 88 of 161 retried 3 times and produced 20-word compressed answers. Without per-batch structured logging, this never surfaces in server logs — the job shows status: complete and the output silently degrades.
- Token cost drift. Token counts per call growing 15% over 6 weeks as prompts accumulate context is invisible without per-call token logging. The cost increase is gradual enough that no single call triggers an alert — until the monthly bill does.
- Rate limit approach. Three batches in the last hour needed retries due to
RateLimitError. Without retry events logged as distinct signals, you don't know you're approaching the provider quota until jobs start failing completely — at which point you've already wasted several dollars per failed restart.
The most expensive failure in an AI pipeline is not a crash — it is a silent quality regression. A crash throws an exception. A quality regression returns HTTP 200 and degraded output. Without observability that logs what the model received and what it returned, you discover quality regressions when users notice them — not when they start.
The Four Things Every AI Pipeline Must Log Before It Touches a Dashboard
Four logging primitives — structured errors, trace identifiers, retry events, and duration plus token counts per call — answer the questions that matter in the first six months of production without any dedicated tool.
Primitive 1 — Structured errors (not string messages)
Every failure in an AI pipeline must return a machine-readable error code, not a human-readable string.
"Something went wrong" is unloggable — it cannot be filtered, counted, or eventually alertable. "AI_ERROR" is
all three. In an affiliate marketing SaaS I built, the 4-gate Server Action pipeline returns 6 distinct error
codes: AUTH_REQUIRED, RATE_LIMITED, LOCKED,
VALIDATION_ERROR, AI_ERROR, and OUTPUT_ERROR. Each code tells you not
just that something failed — it tells you which gate failed, which determines the correct response
(retry, rate limit backoff, schema fix, or auth redirect).
Primitive 2 — Trace identifiers (correlation IDs on every log line)
A log stream of 161 batch entries across 50 concurrent jobs is unsearchable without a correlation ID. With
session_id bound to structlog's context variables at Celery task start,
grep session_id=abc123 returns the complete trace of one job — every batch's token count,
latency, retry history, and final status — in order. This costs one line of code to set up and provides the
same searchability as a distributed tracing system for single-pipeline queries.
Primitive 3 — Retry events (separate signal, logged before each retry)
Every retry attempt must be logged as a distinct event before the retry fires, not swallowed into
the eventual success or failure. If batch 88 succeeded on attempt 3, you need to know it took 3 attempts —
because a retry spike is an early warning of provider instability or quota approach. The signal only exists if
retries are a distinct log event with attempt_number, exception_type, and
wait_seconds. A batch that succeeded on attempt 3 looks identical to a batch that succeeded on
attempt 1 in the final success log — the retry signal is lost unless it's captured before the backoff delay.
Primitive 4 — Duration and tokens per call
Latency and token consumption are leading indicators, not lagging ones. A batch taking 45 seconds instead of
the usual 8 seconds is flagging a problem before it fails. Token counts trending upward week over week means
prompts are growing — and costs are growing with them, invisibly. Both require per-call logging of
duration_ms, prompt_tokens, and completion_tokens on both
success and failure. Logging tokens only on failure misses the drift signal — by the time something fails due
to context bloat, you've already been paying for the growth for weeks.
"The four primitives don't replace a real observability platform. They answer the questions you'll actually be asked in the first six months: which batch failed, how many retries did it take, are token costs growing, and what does the error pattern look like? A dashboard can't answer those questions faster than a grep on a structured log — until you need to answer them at scale."
The Python Implementation: structlog + MongoDB + tenacity as a Primitive Observability Stack
Three tools that are almost certainly already in your FastAPI stack — structlog, MongoDB, and tenacity — combine to implement all four observability primitives with zero additional infrastructure.
structlog for structured per-batch logging
import structlog
from structlog.contextvars import bind_contextvars, clear_contextvars
import time

logger = structlog.get_logger()

# Celery task entry point — bind session-level context ONCE at task start
# Every subsequent log line in this task automatically includes these fields
# without passing the logger or context explicitly to any function
def generate_report_task(session_id: str, metadata: dict) -> None:
    bind_contextvars(
        session_id=session_id,                      # Primitive 2: trace identifier
        report_type=metadata.get("report_type"),    # groups all batches by report type
        task="generate_report",                     # distinguishes from other Celery tasks
    )
    logger.info("report_generation_started", total_batches=161)
    try:
        run_pipeline(session_id, metadata)
    except Exception as exc:
        logger.error("report_generation_failed", error=str(exc), exc_info=True)
        raise
    finally:
        clear_contextvars()  # always clear — prevents context bleed to next task

# Per-batch logging — all four primitives captured in one structured log event
async def process_batch(batch_spec: BatchSpec, session_id: str) -> BatchResult:
    start_time = time.monotonic()
    log = logger.bind(
        batch_id=batch_spec.batch_id,
        batch_index=batch_spec.index,       # e.g. 88 — tells you position in job
        batch_type=batch_spec.type,         # "daily" | "weekly" | "monthly" | "yearly"
    )

    try:
        response = await call_openai_with_retry(batch_spec)
        duration_ms = int((time.monotonic() - start_time) * 1000)

        # Primitive 4: log duration + tokens on EVERY successful call, not just failures
        # Token counts on success reveal drift — you can't see growth from failure logs alone
        log.info(
            "batch_completed",
            duration_ms=duration_ms,
            prompt_tokens=response.usage.prompt_tokens,
            completion_tokens=response.usage.completion_tokens,
            total_tokens=response.usage.total_tokens,
            finish_reason=response.choices[0].finish_reason,  # "stop" vs "length" matters
        )
        return parse_batch_result(response)

    except Exception as exc:
        duration_ms = int((time.monotonic() - start_time) * 1000)
        # Primitive 1: error_type is the primary field — it's filterable and countable
        # error_message is secondary — human-readable but not reliably consistent
        # "RateLimitError" is grep-able; "You exceeded your rate limit on..." is not
        log.error(
            "batch_failed",
            duration_ms=duration_ms,            # latency on failure is equally informative
            error_type=type(exc).__name__,      # "RateLimitError" | "APIStatusError" | etc.
            error_message=str(exc),             # included but not the primary filter key
        )
        raise

# Primitive 3: tenacity retry logging — one line, automatic before every retry
# before_sleep_log emits: attempt_number, exception_type, wait_seconds
# A batch that succeeded on attempt 3 is distinguishable from one that succeeded on attempt 1
from tenacity import retry, wait_exponential, stop_after_attempt, before_sleep_log
import logging

@retry(
    wait=wait_exponential(multiplier=1, min=4, max=60),
    stop=stop_after_attempt(3),
    before_sleep=before_sleep_log(logger, logging.WARNING),  # Primitive 3
    reraise=True,
)
async def call_openai_with_retry(batch_spec: BatchSpec):
    return await openai_client.chat.completions.create(
        model="gpt-4o",
        messages=build_messages(batch_spec),
        max_tokens=TOKEN_BUDGET[batch_spec.type],
    )
tenacity retry logging (Primitive 3)
The before_sleep_log(logger, logging.WARNING) argument to the @retry decorator is
the entire implementation of Primitive 3. It logs attempt_number, exception_type,
and wait_seconds automatically before every backoff delay — at WARNING level so it's immediately
visible when filtering production logs. Without it, a batch that succeeded on attempt 3 after a
RateLimitError with 60-second backoff looks identical in the success log to a batch that
succeeded immediately. The retry signal — which is an early warning of provider instability — is lost. The
structlog context variables ensure that every retry log line automatically carries session_id,
batch_id, and batch_type from the outer scope.
MongoDB as a durable job trace (Primitive 2 at job level)
After every successful batch, PersonalHoroscopeRepository.upsert_batch() writes to MongoDB: the
batch ID, status "complete", and a completed_at timestamp. The job document's
completed_batch_ids[] array is the running record of what succeeded. This is Primitive 2 at job
level — not just a crash recovery mechanism, but a queryable, durable record of job progress. You can open
MongoDB Atlas, query by session_id, and see exactly which batches completed, when each completed,
and which batch was in-flight when any failure occurred.
What this does not give you: the actual prompt and response for each batch. The
completed_batch_ids[] tells you a batch succeeded — it doesn't tell you what the model received
or returned. At $15–25 per report and roughly $1–2 wasted per failed-batch restart (1 batch × ~$0.15 average),
the checkpoint pattern prevents the catastrophic full-restart cost. The structlog layer makes the failure
diagnosable in minutes. Together they are the minimum viable observability layer for a pipeline at this cost
level.
Bind structlog context variables at the start of every Celery task with bind_contextvars() and
clear them in a finally block with clear_contextvars(). This is the single
highest-leverage observability pattern in a Python AI pipeline — every log line in the task automatically
carries the session_id, report_type, and task name without explicit passing. The
entire job's log stream becomes filterable with one grep.
The Next.js Implementation: Structured Server Action Errors as the Observability Foundation
Returning typed discriminated union errors from every Server Action gate — with machine-readable error codes, not string messages — turns every gate failure into a loggable, filterable, eventually-alertable observability event.
The 6 error codes that replace unstructured logging
// Observability through structure: every gate failure returns a typed,
// machine-readable error code — not a human-readable string message.
// This is the foundation: structured errors can be logged, counted, alerted on.
// A string message cannot. "AI_ERROR" is filterable. "Something went wrong" is not.

type GateError =
  | { success: false; code: 'AUTH_REQUIRED'; error: string }
  | { success: false; code: 'RATE_LIMITED'; error: string; retryAfter: number }
  | { success: false; code: 'LOCKED'; error: string }
  | { success: false; code: 'VALIDATION_ERROR'; error: string; details: ZodIssue[] }
  | { success: false; code: 'AI_ERROR'; error: string; retryable: boolean }
  | { success: false; code: 'OUTPUT_ERROR'; error: string }

type ActionResult = { success: true; data: T } | GateError

export async function generateAdCopyAction(
  input: unknown
): Promise> {
  // Gate 1 — Auth (Primitive 1: structured error code, not "Unauthorized" string)
  const session = await auth()
  if (!session?.user?.id) {
    // Emit structured JSON — ready for any log aggregator to filter on code
    console.error(JSON.stringify({ code: 'AUTH_REQUIRED', action: 'generateAdCopy', ts: Date.now() }))
    return { success: false, code: 'AUTH_REQUIRED', error: 'Unauthorized' }
  }

  // Gate 2 — Rate limit (distinct code from AI_ERROR — different alert threshold)
  // RATE_LIMITED spikes → user is hitting limits or system is overloaded
  // AI_ERROR spikes → provider outage or model issue — different remediation
  const { allowed, retryAfter } = await checkRateLimit(session.user.id)
  if (!allowed) {
    console.error(JSON.stringify({
      code: 'RATE_LIMITED', userId: session.user.id, retryAfter, action: 'generateAdCopy'
    }))
    return { success: false, code: 'RATE_LIMITED', error: 'Rate limit exceeded', retryAfter }
  }

  // Gate 3 — Idempotency lock (prevents double-click duplicate generation)
  await acquireLock(session.user.id)

  try {
    // Gate 4a — Input validation (VALIDATION_ERROR = schema problem, not AI problem)
    const parsed = AdCopyInputSchema.safeParse(input)
    if (!parsed.success) {
      return { success: false, code: 'VALIDATION_ERROR',
        error: 'Invalid input', details: parsed.error.issues }
    }

    // Gate 4b — AI call
    // Primitive 4: log duration + model even on SUCCESS — not just on failure
    // Token drift is invisible if you only log on failure
    const start = Date.now()
    const result = await generateAdCopy(parsed.data)
    const durationMs = Date.now() - start

    console.log(JSON.stringify({
      code: 'AI_SUCCESS',           // success is a log event too — not just errors
      userId: session.user.id,
      durationMs,                   // leading indicator: 8s → 45s means context problem
      action: 'generateAdCopy',
      model: 'gemini-2.5-flash',   // model version matters for cost + quality tracking
    }))

    // Gate 4c — Output validation (OUTPUT_ERROR = structured output reliability signal)
    // If this spikes, your model's output schema compliance is degrading
    const validated = AdCopyOutputSchema.safeParse(result)
    if (!validated.success) {
      console.error(JSON.stringify({ code: 'OUTPUT_ERROR', action: 'generateAdCopy', durationMs }))
      return { success: false, code: 'OUTPUT_ERROR', error: 'Output validation failed' }
    }

    return { success: true, data: validated.data }
  } catch (error) {
    return { success: false, code: 'AI_ERROR', error: 'Generation failed', retryable: true }
  } finally {
    releaseLock(session.user.id)
  }
}
What the current implementation can and cannot tell you
With structured error codes logged to Vercel's log drain, you can filter by code and see gate
failure frequencies — RATE_LIMITED spikes, AI_ERROR clusters,
OUTPUT_ERROR frequency. What you cannot answer without a log aggregator or queryable log drain:
how many RATE_LIMITED events happened for a specific user this week. The structured errors are
the right foundation — they need a queryable destination to become full observability. The logs are being
emitted with the correct structure; the missing piece is a sink that supports time-range queries and
user-level aggregation.
If your Server Action errors are string messages — "Something went wrong", "Please try again" — you cannot
filter, count, or alert on them. The first step to LLM observability in a Next.js AI pipeline is replacing
every string error with a typed error code. A log aggregator can filter on
code: 'RATE_LIMITED'. It cannot filter on "Please try again." Do this before adding any
external observability tool — structured errors are the signal; the tool is just the dashboard.
When the DIY Layer Isn't Enough: What a Real Tracing Tool Adds
The four primitives answer operational questions — which batch failed, what retried, are costs growing. A dedicated observability platform answers quality questions: is this prompt hallucinating, is output faithfulness drifting, what did the model actually receive and return for batch 88.
The three capabilities the DIY layer cannot provide
Prompt and response storage. structlog logs token counts but not the actual prompt text or model response. When batch 88 produces a bad answer, you know it retried three times — you don't know what the prompt said or what the model returned. Langfuse stores the full prompt and response for every call, making them replayable days later from a UI. This is the single largest capability gap in the DIY approach.
Cost aggregation. Per-call token counts in structlog require manual aggregation to become
"total cost this week for report type X." At $15–25 per report with 161 calls per job, token drift matters —
but seeing it requires summing total_tokens across log lines, converting to dollars, and grouping
by report_type. Langfuse and Datadog compute this automatically with dashboards that show cost
trends over time.
Output quality evaluation. No amount of logging tells you if the output was factually accurate or semantically correct. LLM-as-judge evals — faithfulness scores, relevance scores, hallucination detection — run against production traces. This requires a platform with an eval pipeline connected to a trace store, not a log drain.
Langfuse self-hosted — the $0 upgrade path
# BEFORE: manual structlog — the DIY four-primitive approach
# Captures: tokens, duration, error_type, retry events (via tenacity)
# Does NOT capture: actual prompt text, response content, cost aggregation

async def process_batch_without_tracing(batch_spec, session_id):
    response = await call_openai_with_retry(batch_spec)
    elapsed_ms = int((time.monotonic() - start_time) * 1000)
    logger.info("batch_completed",
        total_tokens=response.usage.total_tokens,
        duration_ms=elapsed_ms,
        finish_reason=response.choices[0].finish_reason)
    # The prompt text and full response are NOT stored — only the metrics


# AFTER: Langfuse @observe() decorator — additive, no structural code change
# Captures: everything above + full prompt + full response + cost estimate
# + trace UI showing all 161 calls as nested spans for the full job
from langfuse.decorators import observe, langfuse_context

@observe(name="horoscope_batch")  # This is the entire integration — 1 decorator
async def process_batch_with_tracing(batch_spec, session_id):
    # Langfuse automatically captures the prompt and response from the OpenAI call
    # via its SDK integration — no manual logging needed for prompt/response content

    # Add custom metadata to the observation for filtering in the Langfuse UI
    langfuse_context.update_current_observation(
        session_id=session_id,
        metadata={
            "batch_index": batch_spec.index,
            "batch_type": batch_spec.type,
            "total_batches": 161,
        }
    )

    # The existing structlog calls still run — Langfuse is additive, not a replacement
    # structlog handles your log drain; Langfuse handles prompt/response storage and evals
    response = await call_openai_with_retry(batch_spec)
    elapsed_ms = int((time.monotonic() - start_time) * 1000)
    logger.info("batch_completed",
        total_tokens=response.usage.total_tokens,
        duration_ms=elapsed_ms)

    return parse_batch_result(response)

# Setup: pip install langfuse + three environment variables
# LANGFUSE_SECRET_KEY, LANGFUSE_PUBLIC_KEY, LANGFUSE_HOST (or use cloud defaults)
# Self-hosted: docker compose up langfuse — $0, your infrastructure, your data
Langfuse is MIT licensed and self-hosts via Docker Compose at $0. The cloud plan starts at $29/month with
2,000 paying customers at the time of its ClickHouse acquisition in January 2026. For the AI report generation
SaaS I built, wrapping each of the 161 batch calls with @observe() captures the full job trace as
a nested hierarchy of spans in the Langfuse UI — the exact prompt text, full response, token counts, cost
estimate, and duration for every batch, queryable by session_id. No structural change to the
code. The decorator is additive. More on the broader AI architecture decisions behind this pipeline —
including the context engineering approach
that prevents prompt quality issues before they need to be debugged — at hassanr.com.
DIY vs Langfuse vs Datadog vs OpenTelemetry: What Each Approach Gives You
Each approach adds a different tier of capability — start with the DIY four primitives, add Langfuse self-hosted when you need prompt storage and cost tracking, and add OpenTelemetry or Datadog when you need AI traces correlated with infrastructure metrics or strict data residency control.
| Capability | DIY (structlog + structured errors) | Langfuse self-hosted | Datadog LLM Observability | OpenTelemetry (BYO backend) |
|---|---|---|---|---|
| Structured error logging | ✅ | ✅ | ✅ | ✅ |
| Correlation IDs per job | ✅ (manual bind) | ✅ (automatic) | ✅ (automatic) | ✅ (automatic) |
| Retry event logging | ✅ (tenacity) | ✅ | ✅ | ✅ |
| Latency + tokens per call | ✅ (manual log) | ✅ (automatic) | ✅ (automatic) | ✅ (automatic) |
| Prompt + response storage | ❌ | ✅ | ✅ | ✅ (with backend) |
| Cost aggregation dashboard | ❌ | ✅ | ✅ | ⚠️ Custom only |
| Output quality evals | ❌ | ✅ (eval pipelines) | ✅ (LLM-as-judge) | ❌ |
| Trace UI + replay | ❌ | ✅ | ✅ | ✅ (with Tempo/Jaeger) |
| Infrastructure correlation | ❌ | ❌ | ✅ (APM + LLM unified) | ✅ (with Grafana stack) |
| Cost | $0 | $0 self-hosted / $29/mo cloud | $160/mo Pro (40k free spans) | $0 (infra cost only) |
| Vendor lock-in | None | Low (MIT, exportable) | Medium | None (open standard) |
| Best for | Early-stage, first 6 months | Teams needing prompt storage + evals | Teams already on Datadog | Teams with existing OTel infra |
Frequently Asked Questions
Log four primitives in every production LLM application. First, structured errors with machine-readable codes — not string messages — so failures are filterable, countable, and eventually alertable. Second, trace identifiers (correlation IDs) on every log line; without them a log stream of 161 batch entries across 50 concurrent jobs is unsearchable. Third, retry events as distinct log entries before each retry fires — attempt number, exception type, and wait time — so a retry spike becomes a visible pattern. Fourth, duration and token counts per call on both success and failure; latency and token consumption are leading indicators that surface problems before quality degrades. These four can be implemented with structlog in Python or structured console.log calls in Next.js with no dedicated tool required.
Three tools that are likely already in your Python stack cover all four observability primitives at $0. Use structlog for structured JSON logging with contextvars: bind session_id once at task start and every log line carries it automatically. Use MongoDB per-batch upserts as a durable job trace — completed_batch_ids[] is queryable job progress without a tracing UI. Add the tenacity before_sleep_log integration for automatic retry event logging with attempt number, exception type, and wait seconds. For Next.js, return typed discriminated union errors from every Server Action gate — six distinct error codes (AUTH_REQUIRED, RATE_LIMITED, LOCKED, VALIDATION_ERROR, AI_ERROR, OUTPUT_ERROR) replace unstructured string messages. All four observability primitives are implementable this way, as demonstrated in a 161-call production AI pipeline.
Add a dedicated observability tool when the DIY four-primitive layer cannot answer your questions. The DIY layer answers operational questions: which batch failed, how many retries it took, and whether token counts are growing. A platform answers quality questions: what was the exact prompt and response for a specific call (prompt and response storage), what is the total cost per report type this month (cost aggregation), and is output quality drifting from baseline (LLM-as-judge evals). Langfuse self-hosted is the $0 upgrade path — MIT licensed, runs via Docker Compose, and one @observe() decorator per AI function captures full traces without structural code changes. Add Datadog LLM Observability at $160 per month Pro (40,000 free spans per month) when you need AI traces correlated with infrastructure metrics on a unified platform.